LAB RDI Journal
Development of new digital technologies for quality verification could promote utilisation of field biomasses in bioeconomy. In BioCarbonValue project, LAB conducted a weathering test in laboratory to monitor the possible decay in straw quality during storage by using Near Infrared Spectroscopy (NIR) and by analysing microbiological and chemical properties. This article introduces NIR as a possible solution for quality monitoring and describes how storing conditions may impact to the straw quality.
Authors: Niko Rintala, Matti Welin, Eliisa Punttila and Mervi Pulkkinen
1. Introduction
The heterogeneity in quality is typical for field biomass in Nordic regimes, especially in Finland, where the weather conditions variate across years. It is one of key challenges in utilization of straw in biorefinement (Punttila et al 2021b, 49). Securing of the availability of raw material from both quality and volume point of view, would require quality management throughout the supply chain, clearly defined quality criteria and solutions for logistics management (Punttila et al 2021a, 45).
For quality management in practise, there are guidelines to follow in collection and storage of straw to avoid quality risks related to moisture, mold or impurities (Maskinfabrikken Cormall A/S 2020; Punttila et al. 2021a, 28-31; Punttila et al. 2021b, 49). However, the quality monitoring is currently based mainly on senses, or manual measurement of temperature or moisture. Especially in high-value applications, the processes are sensitive to quality, and thus, new methods for quality verification are needed. Development of new digital technologies based on AI and automation for quality verification could promote utilisation of field biomasses in bioeconomy.
There is also a need to understand better the quality degradation of straw during the storage. Different preservation practises have been previously studied by e.g. Lötjönen and Joutsjoki (2017) and Manni and Huuskonen (2021). The quality was assessed subjectively with senses or from samples in laboratory in both experiments, but Manni and Huuskonen utilised also automated temperature measurement in their experiment. The experiment of Lötjönen & Joutsjoki showed that plastic wrapping protected moist (over 25 %) straw from molding. Manni and Huuskonen (2021) studied how straw could be stored as bulk material, which could be more cost-efficient alternative for baling. Storage of bulk straw in flat silo even for moist straw retained the quality very well, but under roof or on the field on windrows the straw was spoiled.
Near Infrared Spectroscopy (NIRS)
Near infrared (NIR) spectroscopy is a non-destructive method of extracting information of the surface of organic matter. By emitting electromagnetic (EM) radiation at specific wavelengths one can observe absorption of energy by material specific molecular structures. In a nutshell, all structures such as functional groups, bind to each other with specific energy signatures which resonate and absorb some of the energy at that specific band when agitated with specific wavenumber’s energy. Therefore, whenever a sample with moisture or hydroxyl structures, for example, is subjected to EM radiation wavelengths 1450nm and 1940nm, we can observe higher difference between emitted and reflected energy amounts at that band as the bonds between H-O start vibrating and stretching (ABVista 2025). Observing NIR wavelengths of 800 – 2500 nm, many organic structures can be catalogued and thus analysed quickly and without damaging the sample. (Chelladurai & Jayas 2014; Eldin 2011).
Practical uses of NIR spectroscopy are many for organic materials. It can be used to differentiate between waste plastics and sort them according to their material composition, and in food industries to determine fat and moisture content of food items (ABVista 2025). Additionally, it can be used to observe freshness of fruits and vegetables as on the surface their decomposition may generate specific markers in NIR spectrum as the decomposition progresses. All this is possible, because molecular structures are very specific to each compound.
Projecting from the capabilities of NIR spectroscopy it should then be also possible to analyse agro-biomasses and determine their quality on the surface. If the masses are subjected to biodegradation in a manner where their composition is altered, or if on their surface starts to grow mold or other growths, their indicators should be observable with NIR. Either the mold and growths would alter the absorption of the NIR EM and thus comparison of spectra of pure sample and the contaminated sample should be noticeable, or if the biomass molecules have been degraded via hydrolysis or any other such means, their spectrum would be change if observed over time.
Usage of NIR in agro culture and biomass quality control
Near-infrared (NIR) spectroscopy has emerged as a robust tool in the analysis of biomasses, particularly for assessing their composition and properties, and especially for soil monitoring and management. The non-invasiveness of the technique offers rapid and cost-effective method for characterizing various biomass types and in-field analysis make it an attractive alternative to traditional and usually manual soil sampling method, which is key for optimizing use of the masses in energy production and other applications. Automation of monitoring soil organic carbon (SOC) and other properties, such as nutrient deficiencies is possible with NIR technology. NIR spectroscopy can accurately assess, for example, nitrogen levels in various plant tissues. Hyperspectral remote sensing and active canopy sensors have been successfully used, with high accuracy, to detect nutrient status, SOC levels, soil conditions and growth parameters in crops and soil, all of which can be then used to determine optimal soil treatments or remedies. (Peddle et al. 2024, Peddle et al. 2025, Jiang et al. 2020, Wiegman et al. 2023, Silva et al. 2023, Reyes & Ließ 2023, Hwang et al. 2023, Samreen et al. 2022).
Combining the sensors and data with machine learning enhances the accuracies reaching up to 0,95 R^2 in identifying nutrient concentrations and can be used to predict parameters such as dry matter, crude protein, and even digestibility of crops, which in turn may be used to predict enzymatic breakdown of crops as their molecular bonds are altered (Sun et al. 2023, Devianti et al. 2023, Yang et al. 2024, Chadalavada et al. 2022, Prananto et al. 2021). Microbial activity transforms nutrients in plants into their usable forms via enzymatic action, and therefore their effects on polymerization levels certain polysaccharides, for example, may be detected in the EM absorption spectra.
Integrating NIR-based sensors into unmanned aerial vehicles (UAVs) allows field monitoring and crop stress detection by providing precise, real-time data on plant health and water requirements of the whole field much more efficiently than regular methods, wherein samples would need to be collected from the field for analysis. This integration allows for the early identification of stress factors, enabling quicker and potentially more accurate crop management. Using both on-site continuous monitoring and UAV combining NIR with machine vision, thermal and other sensors, allows quantifying of maize foliar water content and moisture stress and optimization of field rotations. (Sun et al. 2023, Van Wittenberghe et al. 2024, Ashoka et al. 2023, Gao et al. 2024, Ni et al. 2017). NIR spectroscopy has been applied to predict the saccharification efficiency of corn biomass, with (R²) of 0.80, making it a quite reliable tool for large-scale phenotyping (Pereira-Crespo et al. 2023). Additionally, it has been successfully used to monitor lignin degradation on poplar wood pretreated with Phanerochaete chrysosporium; a study demonstrated that NIR can accurately predict acid-insoluble lignin content (Wittner et al. 2023).
There are numerous advantages, still challenges remain in its widespread adoption, including the need for robust models and integration with existing agricultural practices. Nonetheless, its potential to revolutionize nutrient management in agriculture is clear with its integration with machine learning techniques is paving the way for enhanced predictive capabilities in biomass characterization (Kasapoğlu Çalık et al. 2020). Alternatively, Fourier Transform Infrared (FTIR) spectroscopy combined with machine learning algorithms can be used to predict cellulose and hemicellulose content in maize stalks. Chen et al. (2024) developed a prediction model for FTIR spectra and achieved a coefficient of determination (R²) of 99.21% for cellulose and 99.23%.
2. Methods
Objectives of the demonstration
The objectives of the experiment were the following: 1) to demonstrate the storage of straw in moist and cool conditions and, the impact of plastic wrapping and freezing on quality; 2) to analyse quality changes, especially those that are not possible to observe in sensory evaluation; and 3) to demonstrate NIR technology in quality verification.
Weathering demonstration set up
Before the actual demonstration, a short pilot demonstration was conducted to create a demonstration plan with NIR and available laboratory facilities. Small samples of straw in various crops and qualities were held in the condition cabinet in August-September 2025 and NIR measurements were taken. The demonstration plan, including the number of samples, number of measurements and analyses and monitoring schedule was developed. Due to the restricted available space in the condition cabinet and freezer, it was selected to focus on the impacts of moisture, plastic wrapping and freezing.
The selected raw material was wheat straw, collected in autumn 2023 at cattle farm in the Päijät-Häme region. The raw material was the same as used in the BioCarbonValue carbonisation tests. The straw was regarded as good quality straw, suitable for example animal feed or bedding.
The actual demonstration was performed in laboratory environment as six-month long experiment, from December 2023 to June 2024. At first, the cob parts and weeds were removed from material, after which 15 small bales, approximately in 200 g weight, were made (Picture 1). The bales were divided into five types, numbered 0-4. Three bales were representing one type, as parallel samples.
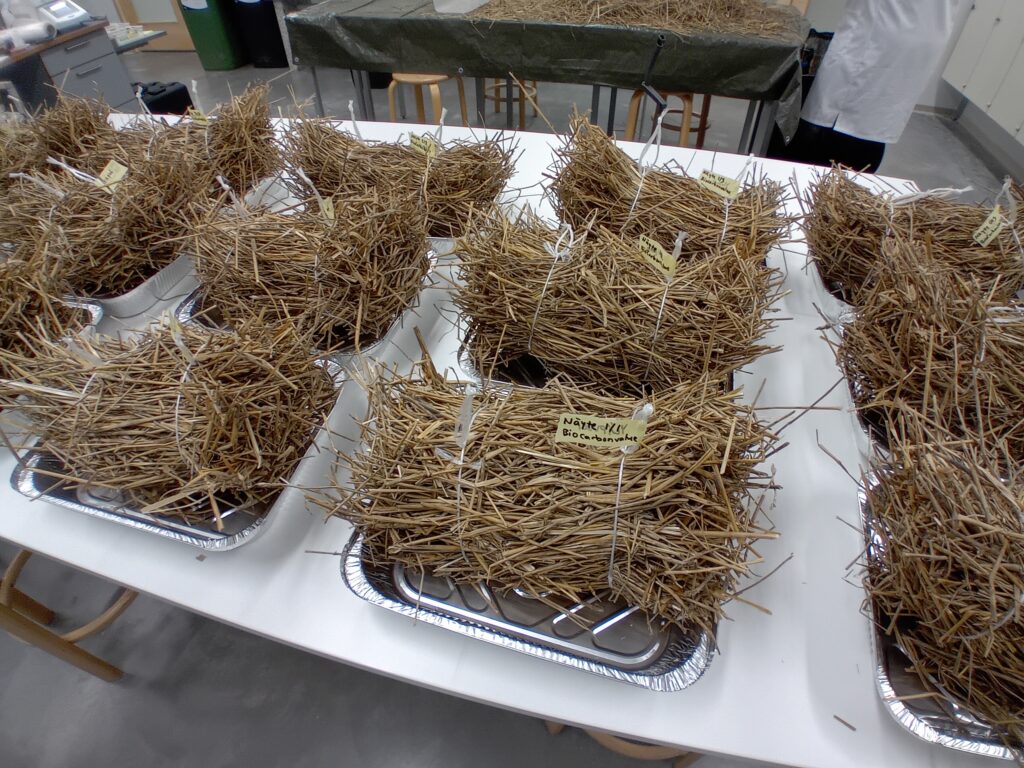
Picture 1. Straw bales ready for demonstration in the laboratory (Eliisa Punttila 2023)
The demonstration plan is illustrated in Figure 1. Straw bales of type 1-4 were placed in the weather condition cabinet, in where moisture was 70 % and temperature +10 °C. After one month, the bales of type 3-4 were wrapped in plastic. When bales were held in conditions cabinet for three months, the bales of type 2 and 4 were transferred to freezer (-18 °C). Straw bales of type 0 were held room temperature for the entire demonstration period. The moisture and temperature was selected to represent conditions, where straw is stored outdoors under roof. Freezing was selected since in Nordic conditions the straw may freeze during winter. Plastic wrapping was selected as third variable, since it may improve possibilities for large scale bioeconomy utilisation of straw.
The demonstration was closed after six months. NIR measurements were taken in the beginning and in the end, as well as once in month for those bales that were not covered in plastic. Samples for microbiological and chemical analyses were taken at the beginning and at the end of the demonstration. The length of the demonstration was expected to reveal possible quality degradation. However, longer period was not possible due to limited project duration.
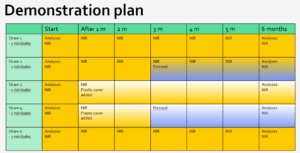
Figure 1. Straw weathering demonstration and measurement plan.
NIR-measurements
NIR measurements were made using NIROne S2.0 sensor connected to the measuring Laptop. NIROne S2.0 sensor is high-performance and compact spectral sensor integrated into a small package made by Spectral Engines. Wavelength range of the S2.0 sensor is from 1550 nm to 1950 nm (Spectral Engines 2023). Each bale sample was measured 8 times, 4 times on one side and 4 times on the other. By performing multiple replicate measurements for each sample, random error is reduced, and the reliability of the measurement is improved. The total number of measurements made during the demonstration period was 740.
Measurement dataset was preprocessed by taking the average of each 8 raw measurements. This operation reduced significantly random noise inherent in the spectroscopic measurement process (Skoog et al. 2018, 105). Preprocessing also included SNV corrections (Standard normal Variate) as well as calculation the 1st and 2nd order derivatives of the samples using Savitzky-Golay filter with window size 25 and polynomial order of 5. These techniques significantly enhance the chemical information for subsequent analysis, because they remove undesirable physical variations and baseline artifacts (Rinnan et al. 2009, 1204-1205). Dataset was analysed using Principal Component Analysis, which is a common technique in dimensionality reduction and clustering analysis especially, if the measurements are high correlated (Wold et al. 1987). As Pelliccia (2018) stated in his Nirpy research blog article “Classification of NIR spectra using Principal Component Analysis in Python”, PCA is almost solely used in NIR-based data analysis. In the NIR case the adjacent measured wavelength reflections are highly correlated (Burns & Ciurczak 2007). PCA scores were plotted into 2 dimension graphs to find out the clustering of the samples. To detect outliers in the dataset, also the Q-residuals and Hotelling’s T2 were calculated and plotted against each other.
Sampling and pre-treatment for microbiological and chemical analyses
At the beginning and the end of the demonstration, two-liter composite samples were made for microbiological studies. At the beginning, a composite sample (original sample before starting the demonstration) was made from the pre-treated wheat straw sample (cobs and weeds removed) and sent to the Seinäjoki Food and Environmental Laboratory (SeiLab). From this composite sample aerobic micro-organisms (30±1 °C, 72±6 h), yeasts (25±1 °C, 5-7 days), and molds (25±1 °C, 5-7 days) were analysed. At the end of the demonstration, the composite samples were made from bale types 0-4. Each bale type 0-4 consisted of three parallel bales, from which five composite samples (bales 0-4) were formed. Samples were similarly analysed in SeiLab.
At the end of the demonstration, the composite samples were made from bale types 0-4. Each bale type 0-4 consisted of three parallel bales, from which a half-liter composite sample was formed. These five half-liter composite samples (bales 0-4) were first chopped with scissors and then ground with a coffee grinder to a grain size of 2-4 mm.
Lignin and carbohydrate analysis methods
The ground composite samples were first extracted with acetone to remove the extractives of the wheat straw samples using the Soxhlet extraction method. Acetone extraction was performed using TAPPI standards T 280 pm-99 (TAPPI 1999) and T 204 cm-17 (TAPPI 2017). Lignin and carbohydrate determinations were started by acid hydrolysis of extractives-free composite samples with sulfuric acid solution (72 %), which resulted in two phases: solid acid-insoluble lignin (Klason lignin) and a liquid containing acid-soluble lignin and carbohydrates. Lignin determinations of the composite samples were performed using TAPPI standard T 222 om-88 (TAPPI 1988) and TAPPI/ANSI standard T 222 om-21 (TAPPI/ANSI 2021). Acid-insoluble lignin was determined gravimetrically, and acid-soluble lignin was determined UV-spectrophotometrically (205 nm). Carbohydrate determinations of the composite samples were made using the TAPPI standard T 249 cm-00 (TAPPI 2000). Carbohydrates were determined using the GC-MS (Gas Chromatography-Mass Spectrometer) device, for which the pH of the liquid obtained from the acid hydrolysis was adjusted to a value close to 4 using a pH meter and weakly basic anion exchange resin. After this, the water was evaporated, the resulting dry residue was dissolved in pyridine and finally, the sample was silylated for GC-MS analysis. In the lignin and carbohydrate determinations, three parallel determinations were made for each composite sample. The results presented in this publication are the averages of these parallel determinations.
3. Results
During the measurement period there were no visible signs on the mold or other impurities found on any of the samples (Picture 2). When the demonstration was closed, any quality changes was not observed in sensory evaluation. It was surprising that the even the plastic wrapping did not cause any visible effect.

Picture 2. Straw bales after 6 months demonstration (Eliisa Punttila 2023)
NIR-measurements analysis
In the following Figure 2, the PCA score plots of 1st and 2nd PCA components are presented. Typically, the first two PCA components captured variability between 60 % to 70 %. The colour of a dot represents the same bale type (0-4). Each bale type has three parallel bales and the numbers beside the dots represent the measurement sequence. Numbers 0 to 14 represents the measurements done in December 2023 and numbers 0 to 2 are the measurements of the bale type 0 (green dots). The Figure 3 represents all the analysed measurements.

Figure 2. PCA 1 vs PCA 2 score plot – all samples
As seen in the Figure 2, all the measurements done in December 2023 as well as almost all the green dots are separated from the rest of the samples. The green samples were not in the environment cabinet.
To take look of just the first and last measurement, PCA scores of bale type 1 and 2 in December and in June 2024 were plotted (Figure 3). The type 1 bales were in the weather condition cabinet period of six months, while type 2 bales were transferred from the weather condition cabinet to the freezer after three months.

Figure 3. Straw bale type 1 and 2 scores, in the beginning and at the end of the demonstration
Although clear separation between the first and last measurements was found in this score plot (Figure 3), there was no clear clusters found in the analysis. Visual observations also confirmed this. Similar analyses were made also for other groups of samples, but clear clusters were not found.
To investigate measurements even further, it was decided to exclude the effect of moisture from the samples. The reasoning for this was the fact that the measurement period was long (6 months) and the ambient moisture level might had affected the results. Water has a strong peak at wavelength 1940 nm. To remove the effect of water from the dataset easily, the reflections from 1800 nm to 1950 nm was rejected. In the following a score plot of PCA component 1 versus 2 is presented.

Figure 4. PCA 1 vs PCA 2 score plot -moisture effect removed.
As shown in the Figure 4, there are no signs of clustering even when the moisture is removed from the samples. As a matter of fact, samples appear to be more randomly scattered than when they contain moisture. For further study, it is imperative to have samples with clear visible quality variation, before making deeper analysis.
Results of microbiological analyses
Figure 5 shows that in bale type 0 (stored for 6 months at room temperature and in a dry place), the number of yeasts increases significantly (from 4100000 cfu to 5900000 cfu) and the number of molds increases slightly (from 34000 cfu to 400000 cfu) compared to the results of the original wheat straw composite sample analysed at the beginning of the weathering test. For bale type 1 (stored for 6 months at 70 % moisture and +10 °C temperature), the number of yeasts and molds decreases significantly (yeasts: from 34000 cfu to <100 cfu, molds: from 4100000 cfu to 280000 cfu) compared to the results of the original wheat straw composite sample analysed at the beginning of the weathering test. For bale types 2-4, the amounts of yeasts and molds don´t clearly indicate the decay of wheat straw caused by moisture, plastic wrapping, and freezing.
For bale type 2 (stored for 3 months at 70 % moisture and +10 °C temperature, and for 3 months in the freezer), the number of aerobic micro-organisms increases significantly (from 28000000 cfu to 44000000 cfu) compared to the results of the original wheat straw composite sample analysed at the beginning of the weathering test. For bale types 0, 1, 3, and 4, the amounts of aerobic micro-organisms don´t clearly indicate the decay of wheat straw caused by moisture, plastic wrapping, and freezing.

Figure 5. Microbiological results of the wheat straw composite samples (original and bales 0-4).
Results of lignin and carbohydrate analyses
Figure 6 shows that the results of acid-insoluble lignin vary between 23.8-25.7 % of dry matter, and the results of acid-soluble lignin vary between 2.46-2.60 % of dry matter. There is no clearly noticeable difference between those lignin results of extractives-free wheat straw composite samples (bale types 0-4). Based on lignin results, it can´t be seen any decay in the quality of wheat straw due to moisture, plastic wrapping, or freezing.
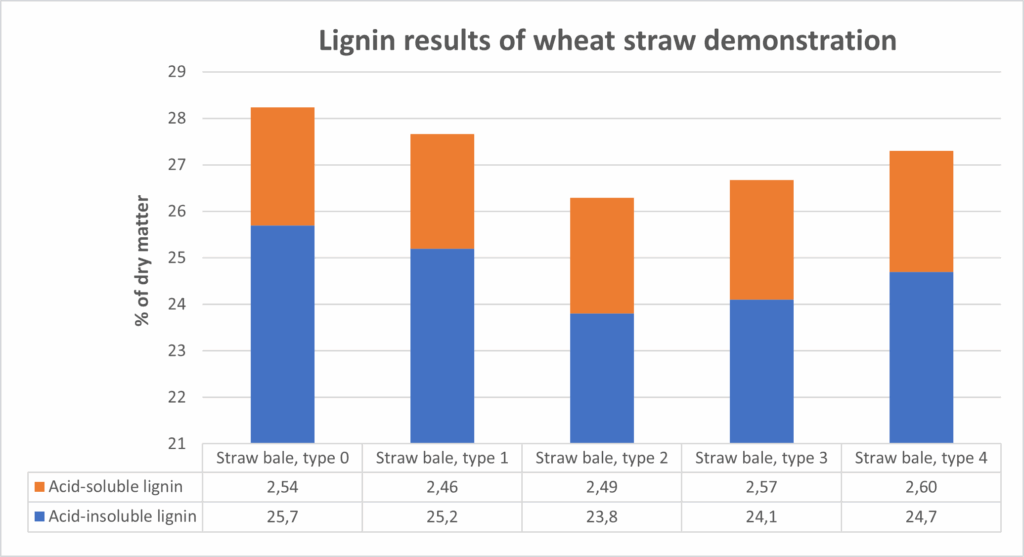
Figure 6. Lignin results of the extractives-free wheat straw composite samples (bales 0-4).
Figure 7 shows that the carbohydrate results for bale types 0-4 vary as follows: arabinose 1.15-1.31 % of dry matter, xylose 16.5-19.7 % of dry matter, mannose 0.20-0.26 % of dry matter, galactose 0.24-0.34 % of dry matter, glucose 32.1-34.0 % of dry matter and glucuronic acid 0.04-0.11 % of dry matter. Based on carbohydrate results of bale types 0-4, it can´t be seen any decay in the quality of wheat straw due to moisture, plastic wrapping, or freezing.
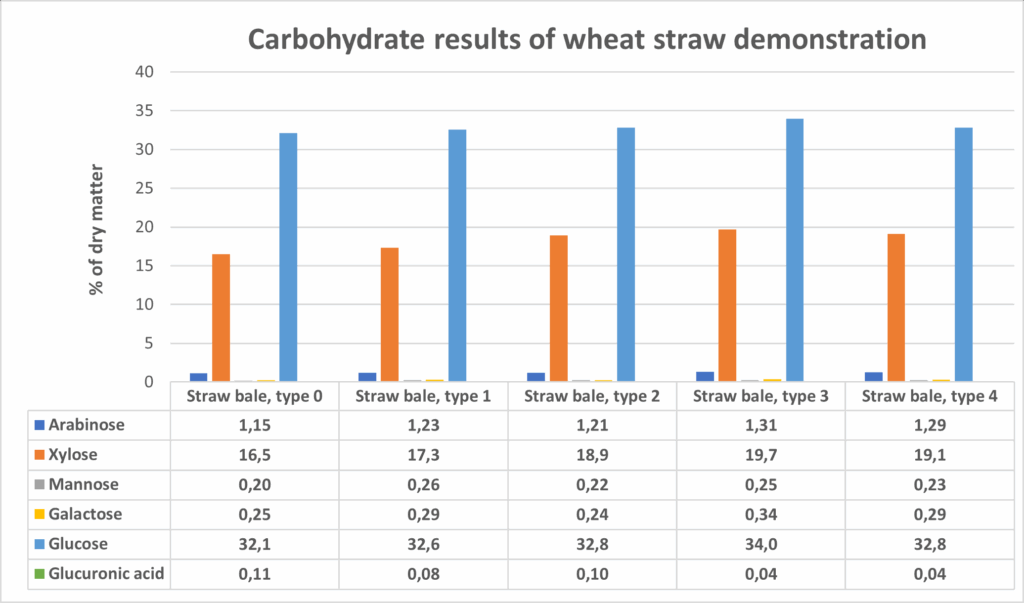
Figure 7. Carbohydrate results of the extractives-free wheat straw composite samples (bales 0-4).
5. Conclusions
In the straw weathering demonstration, the aim was to demonstrate different storage practises of straw and to reveal possible quality decay that is not possible to observe with sensory evaluations. Also, NIR technology was tested in monitoring these kind of non-visible quality changes. Chemical and microbiological analyses were made for verifying possible quality changes.
As a result, the six-month long experiment including storage in cool and moist conditions, plastic wrapping and freezing, did not cause any visible impact on straw material. Despite the test period and variable storage conditions, no clear changes were observed when testing with NIR and chemical analyses either. It can be said that the quality of originally dry, good quality straw remains quite well in different storage conditions in a half-year period.
However, as the third objective of the weathering test was to demonstrate NIR technology in quality verification, this objective was not successfully reached. The weathering test outcome did not support the NIR demonstration point of view.
6. Discussion
The test setup was prepared to simulate outdoors storage under a roof or wrapped in plastics and with temperature falling below freezing point. These conditions preserve material better compared to moisture heavy storing, such as with exposure to rain. Due to the limitations of the laboratory facilities, it was not possible to increase the number of different variables in storage conditions, or number of different types or qualities of raw materials.
Ultimately this demonstration didn’t produce visually degraded straw. This affected NIR observations as well, with the lack of reference points. The literature review didn’t find research focusing on observation of mold, but it was noted that many of the other conditions could be observed in-situ. Lignocellulosic degradation via enzymatic action of microbes can be observed in crops as polysaccharides are broken down and transformed into energy for microbes growth, this in turn changes the initial molecular bonding in crops. For example, lignin peroxidase is a strong oxidant that specifically targets non-phenolic structures of lignin, facilitating breakdown. However, careful calibration is necessary for accurate prediction of polymerization levels of polysaccharides. Studies concerning different application of NIR spectroscopy indicate that it is possible to observe changes in crops and determine this way the presence of degradating biome.
Literature supports the hypothesis that straw conditions would be observable as are the soil conditions, but since no clear point of degradation could be observed in either the laboratory nor NIR testing, it must be concluded that the preservation of the samples has been too good for such short-term observation period.
Conjecting from the lack of noticeable results in any testing, it would be beneficial to increase the storage times further, especially since there is literature claiming that most degradation with straws will begin after the first year in storage. A longer observation period could then increase the possible degradations and thus molecular changes to increase the signals with NIRS. Further research is also needed on the wavelength region scales. In this experiment the full NIR wave range was not observed and thus, some potential signal changes could have gone unnoticed.
Acknowledgements
The study was conducted as part of the project BioCarbonValue, a joint research project of LAB University of Applied Sciences and VTT Technical Research Centre of Finland, funded by Business Finland 2023-2024. The project aimed at developing alternative carbon materials to replace fossil-based carbon in high-value applications by utilisation of agricultural and food industry side streams.
References
ABVista 2025. A Guide to NIR: Understanding NIR spectra. Cited 11 Feb 2025. Available at https://www.abvista.com/news/a-guide-to-nir-understanding-nir-spectra
Ashoka, P., Singh, O., Singh, B., Sunitha, N. H., Saikanth, D.R., & Sreekumar, G., 2023. Enhancing Agricultural Production with Digital Technologies: A Review. International Journal of Environment and Climate Change. Vol. 13, 409-422. Cited 21 Feb 2025. Available at https://doi.org/10.9734/IJECC/2023/v13i92250
Burns, D.A. & Ciurczak, E.W. (Eds.). 2007. Handbook of Near-Infrared Analysis (3rd ed.). CRC Press.
Chadalavada, K., Anbazhagan, K., Ndour, A., Choudhary, S., Palmer, W., Flynn, J.R., Mallayee, S., Pothu, S., Prasad, K.V.S.V., Varijakshapanikar, P., Jones, C. S., & Kholová, J. 2022. NIR Instruments and Prediction Methods for Rapid Access to Grain Protein Content in Multiple Cereals. Sensors. Vol. 22 (10), 3710. Cited 11 Feb 2025. Available at https://doi.org/10.3390/s22103710
Chelladurai, V. & Jayas, D.S. 2014. Near-infrared Imaging and Spectroscopy. In: Manickavasagan, A., Jayasuriya, H. (eds) Imaging with Electromagnetic Spectrum. Springer, Berlin, Heidelberg. Cited 11 Feb 2025. Available at https://doi.org/10.1007/978-3-642-54888-8_6
Chen, F., Liu, X., Lu, C., Ruan, M., Wen, Y., Wang, S., Song, Y., Li, L., Zhou, L., Jiang, H., & Wu, L. 2024. High-throughput prediction of stalk cellulose and hemicellulose content in maize using machine learning and Fourier transform infrared spectroscopy. Bioresource Technology. Vol. 413, 131531. Cited 6 Jun 2025. Available at https://doi.org/10.1016/j.biortech.2024.131531
Devianti, S., Ramayanty, B. & Agustami, S. 2022. Vis-NIR spectra combined with machine learning for predicting soil nutrients in cropland from Aceh Province. Indonesia. Case Studies in Chemical and Environmental Engineering. Vol. 6, 100268. Cited 21 Feb 2025. Available at https://doi.org/10.1016/j.cscee.2022.100268
Eldin, A. B. 2011. Near Infra Red Spectroscopy. In: Isin Akyar (ed). Wide Spectra of Quality Control. InTech Open. Cited 11 Feb 2025. Available at http://dx.doi.org/10.5772/24208
Gao W., Zeng W., Li S., Zhang L., Wang W., Song, J. & Wu, H., 2024. Remote sensing estimation of sugar beet SPAD based on un-manned aerial vehicle multispectral imagery. PLOS ONE. Vol 19(6), e0300056. Cited 21 Feb 2025. Available at https://doi.org/10.1371/journal.pone.0300056
Hwang, S., Chung, H., Lee, T., Kwak, H., Choi, I., and Yeo, H. 2023. Investigation of NIR spectroscopy and electrical resistance-based approaches for moisture determination of logging residues and sweet sorghum. BioResources. Vol. 18(1), 2064-2082. Cited 11 Feb 2025. Available at https://doi.org/10.15376/biores.18.1.2064-2082
Jiang, J.; Zhang, Z.; Cao, Q.; Liang, Y.; Krienke, B.; Tian, Y.; Zhu, Y.; Cao, W. and Liu, X. Use of an Active Canopy Sensor Mounted on an Unmanned Aerial Vehicle to Monitor the Growth and Nitrogen Status of Winter Wheat. Remote Sensing. Vol. 12 (22), 3684. Cited 11 Feb 2025. Available at https://doi.org/10.3390/rs12223684
Kasapoğlu Çalık, M., Aydin E. S. and Yücel O. 2020. Prediction of proximate analysis and process temperature of torrefied and pyrolyzed wood pellets by near-infrared spectroscopy coupled with machine learning. Mugla Journal of Science and Technology. Vol. 6(2), 99-110. Cited 11 Feb 2025. Available at https://doi.org/10.22531/muglajsci.785974
Lötjönen, T. & Joutsjoki, V. 2017. Harvest and storage of moist cereal straw – experiments 2013 – 2014 and 2015 – 2016. Helsinki: Cleen. CLIC Innovation Research report D 1.2.1-2. Cited 29 Jan 2025. Available at http://urn.fi/URN:NBN:fi-fe201704035931
Manni, K. & Huuskonen, A. 2021. Oljen irtosäilöntä. In: Manni, K. & Huuskonen, A. (edits.). Nautatilojen kuivikehuolto. Luonnonvara- ja biotalouden tutkimus 54/2021. Luonnonvarakeskus. Helsinki. 7–21. Cited 29 Jan 2025. Available at http://urn.fi/URN:ISBN:978-952-380-251-3
Maskinfabrikken Cormall A/S. 2020. Straw quality control. Cited 29 Jan 2025. Available at https://www.cormall.dk/wp-content/uploads/2020/02/Straw-quality-control_ENG.pdf
Ni, J., Yao, L., Zhang, J., Cao, W., Zhu, Y., & Tai, X. 2017. Development of an Unmanned Aerial Vehicle-Borne Crop-Growth Monitoring System. Sensors. Vol. 17(3), 502. Cited 21 Feb 2025. Available at https://doi.org/10.3390/s17030502
Peddle, S., Cando-Dumancela, C., Krauss, S., Liddicoat, C., Sanders, A. & Breed, M. 2024. Agricultural land-use legacies affect soil bacterial communities following restoration in a global biodiversity hotspot. Biological Conservation. Vol. 290, 110437. Cited 21 Feb 2025. Available at https://doi.org/10.1016/j.biocon.2023.110437
Peddle, S.D., Hodgson, R.J., Borrett, R.J., Brachmann, S., Davies, T.C., Erickson, T.E., Liddicoat, C., Muñoz-Rojas, M., Robinson, J.M., Watson, C.D., Krauss, S.L. and Breed, M.F. 2025. Practical applications of soil microbiota to improve ecosystem restoration: current knowledge and future directions. Biological Reviews. Vol. 100 (1), 1-18. Cited 21 Feb 2025. Available at https://doi.org/10.1111/brv.13124
Pelliccia, D. 2018. Classification of NIR spectra using Principal Component Analysis in Python. Nirpy Research Blog. Cited 9 Jun 2025. Available at https://nirpyresearch.com/classification-nir-spectra-principal-component-analysis-python/
Pereira-Crespo, S., Gesteiro, N., Lozano, A., Gómez, L., & Santiago, R. 2023. Application of Near Infrared Reflectance Spectroscopy to Determine Saccharification Efficiency of Corn Biomass. Research Square. Cited 26 June 2025. Available at https://doi.org/10.21203/rs.3.rs-3495770/v1
Prananto J.A., Minasny B. & Weaver T. 2021. Rapid and cost-effective nutrient content analysis of cotton leaves using near-infrared spectroscopy (NIRS). PeerJ. Vol. 9, e11042. Cited 21 Feb 2025. Available at https://doi.org/10.7717/peerj.11042
Punttila, E., Luste, S., Tuominen, K. & Suomi, H. 2021a. Oljen toimitusverkon perustamisen reunaehdot – Case: Heinolan biojalostamo. Vihreän kasvun biokylä -hanke, loppuraportti. Lahti: LAB-ammattikorkeakoulu. LAB-ammattikorkeakoulun julkaisusarja, osa 34. Cited 29 Jan 2025. Available at https://urn.fi/URN:ISBN:978-951-827-389-2
Punttila, E., Luste, S., Tuominen, K. & Suomi, H. 2021b. Liite 1. Riskianalyysi. In Punttila, E., Luste, S., Tuominen, K. & Suomi, H. Oljen toimitusverkon perustamisen reunaehdot – Case: Heinolan biojalostamo. Vihreän kasvun biokylä -hanke, loppuraportti. Lahti: LAB-ammattikorkeakoulu. LAB-ammattikorkeakoulun julkaisusarja, osa 34. Cited 29 Jan 2025. Available at https://urn.fi/URN:ISBN:978-951-827-389-2
Reyes J. & Ließ M. 2023. On-the-Go Vis-NIR Spectroscopy for Field-Scale Spatial-Temporal Monitoring of Soil Organic Carbon. Agriculture. Vol. 13(8), 1611. Cited 21 Feb 2025. Available at https://doi.org/10.3390/agriculture13081611
Rinnan, Å., Berg, F. and Engelsen, S.B. 2009. Review of the most common pre-processing techniques for near-infrared spectra. TrAC Trends in Analytical Chemistry. Vol. 28(10), 1201-1222. Cited 11 Jun 2025. Available at https://www.academia.edu/14421738/Review_of_the_most_common_pre_processing_techniques_for_near_infrared_spectra
Samreen, T., Tahir, S., Arshad, S., Kanwal, S., Anjum, F., Nazir, M. Z., & Sidra-Tul-Muntaha. 2022. Remote Sensing for Precise Nutrient Management in Agriculture. Environmental Sciences Proceedings. Vol. 23(1), 32. Cited 21 Feb 2025. Available at https://doi.org/10.3390/environsciproc2022023032
Silva, L., Conceição, L.A., Lidon, F.C. & Maçãs, B. 2023. Remote Monitoring of Crop Nitrogen Nutrition to Adjust Crop Models: A Review. Agriculture. Vol. 13, 835. Cited 21 Feb 2025. Available at https://doi.org/10.3390/agriculture13040835
Skoog, D., Holler, J. & Crouch, S. 2018. Principles of Instrumental Analysis. 7th edition. Boston: Cengage Learning.
Spectral Engines. 2023. NIRONE Sensor S. Product brochure. Cited 5 Feb 2025. Available at https://spectralengines.com/wp-content/uploads/2023/12/SE_NIRONE_Sensor_S_2023_EN_web.pdf
Sun X, Yang Z, Su P, Wei K, Wang Z, Yang C, Wang C, Qin M, Xiao L, Yang W., Zhang M., Song X & Feng M. 2023. Nondestructive monitoring of maize LAI by fusing UAV spectral and textural features. Frontiers in Plant Science. Vol. 14, 1158837. Cited 21 Feb 2025. Available at https://doi.org/10.3389/fpls.2023.1158837
TAPPI. 1988. T 222 om-88 Acid-insoluble lignin in wood and pulp. Official Test Method 1983, Revised 1988. Peachtree Corners, GA, US: TAPPI Standards Department.
TAPPI. 1999. T 280 pm-99 Acetone extractives of wood and pulp. Provisional Method 1999. Peachtree Corners, GA, US: TAPPI Standards Department.
TAPPI. 2000. T 249 cm-00 Carbohydrate composition of extractive-free wood and wood pulp by gas-liquid chromatography. Classical Method 1985, Reaffirmed 2000. Peachtree Corners, GA, US: TAPPI Standards Department.
TAPPI. 2017. T 204 cm-17 Solvent extractives of wood and pulp. Revised 2007, Reaffirmed 2017. Peachtree Corners, GA, US: TAPPI Standards Department.
TAPPI/ANSI. 2021. T 222 om-21 Acid-insoluble lignin in wood and pulp. Revised 1988, Reaffirmed 1998, Revised 2002, Reaffirmed 2006–2021. Peachtree Corners, GA, US: TAPPI Standards Department.
Van Wittenberghe, S., Amin, E., Pascual-Venteo, A.B., Pérez-Suay, A., Tenjo, C., Sabater, N., van der Tol, C., Drusch, M., & Moreno, J.F. 2024. Retrieval of leaf-level fluorescence quantum efficiency and NPQ-related xanthophyll absorption through spectral unmixing strategies for future VIS-NIR imaging spectroscopy. Remote Sensing of Environment. Vol. 300, 113879. Cited 21 Feb 2025. Available at https://doi.org/10.1016/j.rse.2023.113879
Wittner, N., Gergely, S., Slezsák, J., Broos, W., Vlaeminck, S. E., & Cornet, I. 2023. Follow-up of solid-state fungal wood pretreatment by a novel near-infrared spectroscopy-based lignin calibration model. Social Science Research Network. 106725. Cited 6 June 2025. Available at https://doi.org/10.2139/ssrn.4352587
Wiegman, A., Underwood, K., Bowden, W., Augustin, I., Chin, T. & Roy, E. 2023. Modeling Phosphorus Retention and Release in Riparian Wetlands Restored on Historically Farmed Land. Journal of Ecological Engineering Design. Vol. 1(1). Cited 21 Feb 2025. Available at https://doi.org/10.21428/f69f093e.a06ba868
Wold, S., Esbensen, K., & Geladi, P. 1987. Principal component analysis. Chemometrics and Intelligent Laboratory Systems. Vol. 2(1-3), 37–52.
Yang, S., Wang, Z., Ji, C., Hao, Y., Liang, Z., Yan, X., Qiao, X, Feng, M., Xiao, L., Song, X., Zhang, M., Li, G., Shafiq, F., Yang, W., Wang, C. 2024. Efficient prediction of SOC and aggregate OC components by continuous wavelet transform spectra under different feature selection methods. Computers and Electronics in Agriculture. Vol. 217, 108550. Cited 21 Feb 2025. Available at https://doi.org/10.1016/j.compag.2023.108550
Authors
Niko Rintala works as a Development Engineer and specialist in various RDI projects focusing on material sciences and processes in the Faculty of Technology at LAB University of Applied Sciences.
Matti Welin works as a principal lecturer and RDI Specialist in the Faculty of Technology at LAB University of Applied Sciences, where he focuses primarily on IoT, machine learning, and artificial intelligence.
Eliisa Punttila works as an RDI Specialist in the Faculty of Technology in the LAB University of Applied Sciences. In the BioCarbon Value project she worked as a project manager.
Mervi Pulkkinen works as a Laboratory Supervisor in the teaching and analysis laboratories of the Faculty of Technology at LAB University of Applied Sciences. In the BioCarbonValue project she worked as a specialist.
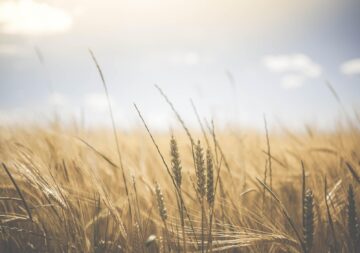
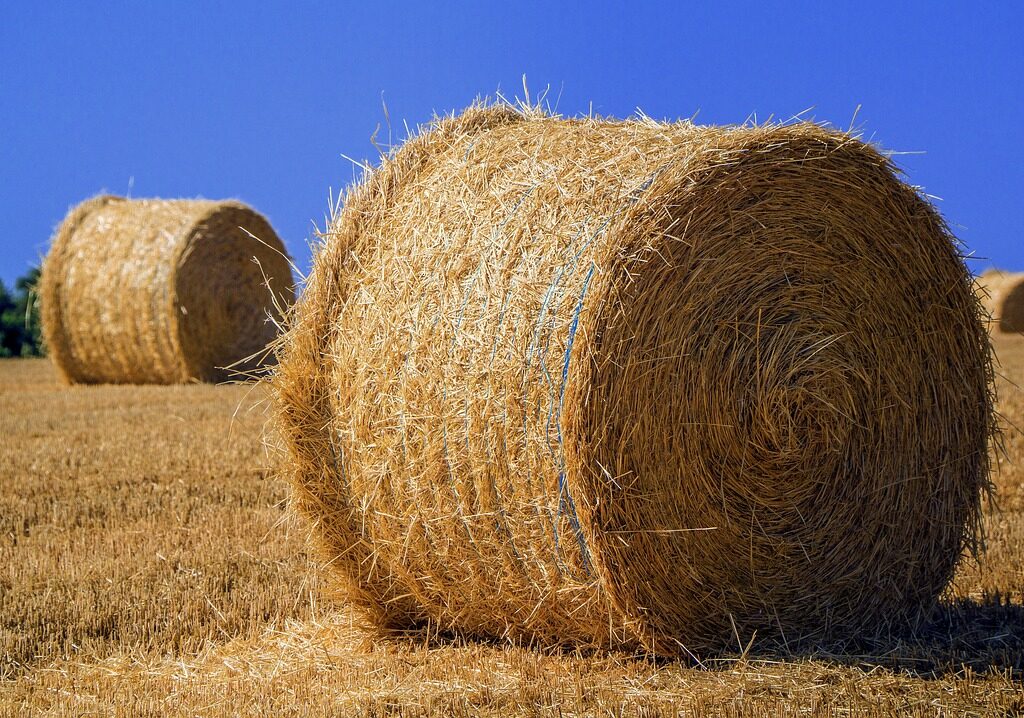
Illustration: https://pixabay.com/fi/photos/maanviljely-sato-ala-viljely-vilja-4375203/ (Pixabay licence)
Reference to this article
Rintala, N., Welin, M., Punttila, E. & Pulkkinen, M. 2025. Use of NIR technologies in agro-biomass quality monitoring. LAB RDI Journal. Cited and date of citation. Available at https://www.labopen.fi/en/lab-rdi-journal/use-of-nir-technologies-in-agro-biomass-quality-monitoring/